Desktop app
pysrim2 app opens a window for pysrim2. It guides you through setting up SRIM: it shows how
SRIM runs on your machine, installs what is still missing, and checks the result. It also edits
a run setup: the target (Geometry tab), the beam (Beam tab), the run settings (Run settings tab)
and an optional scan (Scan tab). It runs the setup, shows the run as it goes (Progress tab), and
shows and saves the results (Results tab).
The app is optional. The library (import srim) and the command line never import Qt, so
they work without it.
Install
The app needs the app extra. It holds PySide6 (the Qt bindings: its Essentials, Addons and
WebEngine parts, 6.12 or newer), matplotlib, the notebook tools marimo and JupyterLab, nbformat,
and nbconvert with playwright for the PDF export. PySide6 alone is a download of over 100 MB (about
340 MB installed), so the extra is not part of the default install, and the container image stays
small. Install it into the pysrim2 you already use:
pysrim2 install app
pysrim2 install app runs the install that matches how pysrim2 was installed. A
uv tool install is reinstalled with the extras it has plus app; a pip install gets
pysrim2[app] at the same version. It then downloads the Chromium that the PDF export prints
with (playwright’s chromium step). You can also install the extra directly:
uv tool install "pysrim2[app]"
pip install "pysrim2[app]"
A direct install does not download the Chromium. Run pysrim2 install app as well, or the PDF
export says to reinstall the app.
In a source checkout (an editable install) the command does not run the install; it prints
uv sync --extra app for you to run in the checkout. Then download the Chromium with
uv run python -m playwright install chromium.
The app needs Python 3.14 or older for now: PySide6 does not support Python 3.15 yet. On
Python 3.15 the app extra installs nothing, and pysrim2 install app and pysrim2 app
say so. Use Python 3.14 for the app, for example uv tool install --python 3.14 "pysrim2[app]".
Installing the app needs no administrator rights.
Start
pysrim2 app
If the app is not installed, the command says so and asks you to run pysrim2 install app.
Setup
The setup opens by itself on the first check if no route is chosen yet or a check is not ready. A route saved on another machine, or one this platform does not offer, counts as no route until you choose one; the app does not change the settings file at startup. You can reopen it at any time from the Setup menu (Run setup…), or by clicking the setup link in the status bar.
The setup has four pages: Welcome to pysrim2, Choose how SRIM runs, Install what is missing and Check the installation.
SRIM runs in one of three routes:
Route |
What it does |
Offered on |
|---|---|---|
Native TRIM.exe |
Runs SRIM’s own |
Windows |
Wine (pysrim2’s own wine prefix) |
Runs |
Linux only |
Container (Podman or Docker) |
Runs SRIM inside the pysrim2 container image |
Every platform |
The route that is recommended on your machine is marked “(recommended)” and selected first. A route you chose before is preselected instead. On macOS only the container route is offered, with a note that native SRIM is not supported there.
On the install page each step is listed as installed, to install, or needs admin rights. Install runs the steps that need no administrator rights. Check again plans the steps once more and checks them again.
The app never runs a command that needs administrator rights (for example the package
installs or regsvr32 on Windows). It shows those commands in a box instead: use
Copy commands, run them in a terminal, then press Check again. The install and the
check are the same as in the command line (see Command line), so pysrim2 install in a
terminal can also finish what the app left.
Finish saves the route. Cancel changes nothing. Back, Cancel and closing the wizard are unavailable while an install runs.
Status bar
The status bar at the bottom of the window says what to do next, one line at a time. It lists, in this order:
Choose how SRIM runs: open the setup until a route is chosen, and a line for each check that is not ready, in the form
<check>: <detail>. Fix: <what to run>.What the run setup still needs (for example Choose the ion: pick an element on the Beam tab), then the problems the library finds in it. A note that does not stop a run comes last.
The run setup is complete when nothing is listed.
The first line is a link when it names a place: clicking it opens the setup, or the tab and the field it names. When there are more lines, the bar says how many more, and its tooltip lists all of them.
Geometry
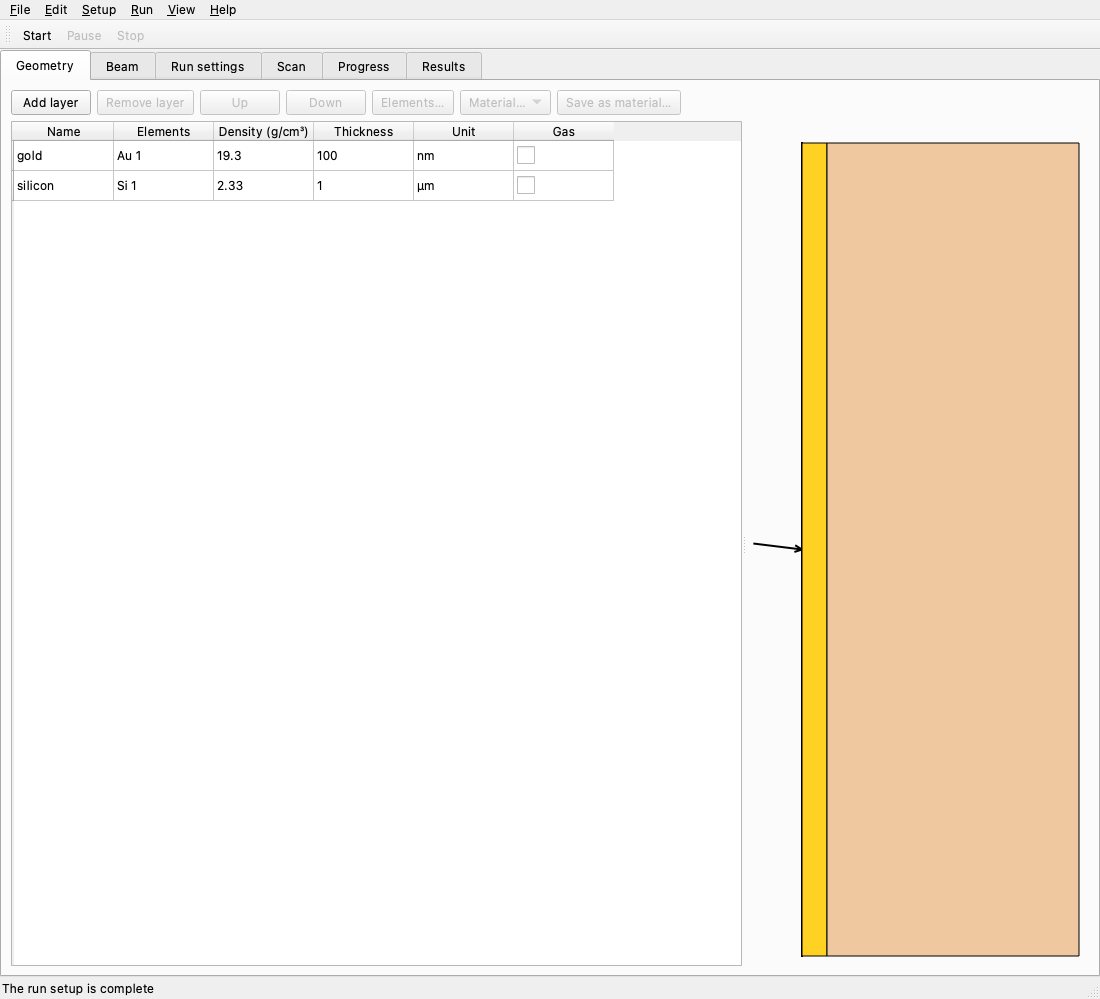
The Geometry tab edits the layers of the target. The table has one row per layer; the first row is the layer the beam reaches first. Its columns are:
Column |
What it holds |
|---|---|
Name |
A name for the layer (optional; the cell is blank when there is none) |
Elements |
The elements and their amounts, for example |
Density (g/cm³) |
The density |
Thickness |
The thickness, shown in the layer’s unit |
Unit |
The unit of the thickness: Å, nm, µm or mm (the value is stored in nm) |
Gas |
Ticked for a gas layer |
Type a number into a cell and press Enter. A comma works as a decimal point (1,5 is 1.5).
Text that is not a number is refused and the old value stays. An empty cell is a missing value:
the status bar names it. A value the library cannot use (for example a negative thickness) is
shown in red, with the library’s message as its tooltip.
Add layer, Remove layer, Up and Down change the layers; you can also drag a row to a new place. Elements… opens the elements of the selected layer in a dialog, with one row per element: the element (Choose…, which opens the periodic table), its amount, and its displacement, lattice and surface energies in eV. Each new element starts with SRIM’s usual values (amount 1, displacement 25 eV, lattice 0 eV, surface 3 eV).
Material… fills the selected layer from a menu. Its first part is the common materials
(by name; each one’s formula and density come from srim/data/compounds.yaml); its second part,
My materials, is what you saved before. A material replaces the layer’s name, density, gas
flag and elements. Save as material… keeps the selected layer’s density, gas flag and
elements under a name you choose; saving a name that exists replaces that material. My materials
are stored in materials.json in pysrim2’s data directory, in the app folder (<data dir>/app/materials.json, see Installation). A file that cannot be read counts as no
materials.
The periodic table has one button per element, Z = 1 to 92 (SRIM’s range). An element’s menu has Natural first, which is SRIM’s own mass for the element, the same as a scripted run gets when it names no mass. The other entries are the element’s natural isotopes, most abundant first, and choosing one sets that mass for the ion or the element. Only an isotope is stored with a mass; natural elements are stored without one.
Beside the table the target is drawn to scale. Each layer’s width follows its thickness, the beam comes in from the left at its angle, and a click on a layer selects its row (and a row selects its layer). A thin layer next to a thick one is still drawn a few pixels wide so that it stays visible and clickable. Such a layer is drawn wider than to scale: it has a dashed outline, a “≠” mark and a tooltip that says so. A layer with no usable thickness is drawn the same way. When there are more layers than fit at that width, each gets an equal width and none is to scale. The picture is only a guide: the numbers in the table are the setup.
Beam
The Beam tab sets the ion, the number of ions and the beam quantities. The Ion button opens the periodic table, with the isotopes as on the Geometry tab. Number of ions is a whole number of at least 1.
Each beam quantity has its own editor: Energy (keV), Angle (degrees), Azimuth (degrees) and the position Position y, Position z and Depth (nm). Energy and angle have no Not set choice, but an energy that is missing is named by the status bar. Azimuth and the three positions are Not set by default, which leaves them out of the setup. Setting one position coordinate creates the position, with the other two at 0.0. Not set on a coordinate removes the whole position when the other two are 0.0 (or Not set); otherwise that coordinate is stored as 0.0.
Each quantity has a Kind:
Fixed value is one number.
Gaussian (mean, sigma), Uniform (low, high), Triangular (low, mode, high) and Log-normal (mu, sigma) are the distributions. The parameters are those of the Beam distributions guide.
Python function takes a reference written as
python:<module>:<name>, for examplepython:my_beams:density. The module must be importable by its name from the folder you run from, so put it next to your script. A function in__main__, a lambda and a function made inside another function are refused, because a worker process cannot import them.Histogram file is read with Load…. The file’s bars are shown in a preview, and OK uses it (Cancel keeps the setup as it was). A file that is broken (one row, decreasing edges, values that are not numbers) is refused with the library’s message.
A distribution (every kind but a fixed value) also has Limit to, with optional low and high bounds: values outside the range are not sampled.
Under each editor the density of that quantity is drawn: a smooth curve for a distribution, and a step line for a histogram or a uniform distribution. A binned beam also marks its bin edges with dashed lines. A value the library refuses is not drawn. The tab scrolls, so all six plots can be reached in a small window.
A setup with a distribution, an azimuth or a position is a distributed beam, and the tab then shows the Beam mode. A single energy and angle is one SRIM run, and the tab says so instead. The modes are:
Automatic (the default) is exact for calculations 1 and 2, and binned for the others. The line under the choice says which one it picked and why.
Exact (TRIM.DAT) samples every ion from the distributions and runs SRIM once, with the sampled ions in SRIM’s
TRIM.DATfile. One SRIM run holds up to 99 999 ions; a larger exact beam is split into several runs bysrim.beam.run_beam(see Beam distributions).Binned splits the beam into bins of energy and angle and runs SRIM once per bin. Energy bins and Angle bins set the number of bins (Automatic is 10 and 6, up to 2000). The count can be edited only for a distributed energy or angle, and only when it is binned. A setup whose bins are written as edges keeps them, and the count shows without being editable.
For the meaning of the modes and of the sampling, see Beam distributions. For the file itself, see run.yaml.
Histogram files and saving. A histogram file is read from the folder of the setup when it is
relative to it. When you save, a histogram file that lies outside the folder of the saved
run.yaml is copied into a beam/ folder next to it, and the setup refers to the copy (a
second file with the same name becomes name-2.txt, and so on). The setup then opens when its
folder moves. A histogram file that cannot be found stops the save with a message.
Run settings
The Run settings tab sets the calculation and the options that SRIM reads from TRIM.IN.
Each control stores one item in the setup, and the library writes it to the TRIM.IN line
named here:
Control |
Setup item |
|
|---|---|---|
Calculation |
|
cascade options |
Random seed |
|
cascade options |
Description |
|
target |
Ranges, Backscattered ions, Transmitted ions, Sputtered atoms |
|
disk files |
Collisions |
|
disk files |
EXYZ.txt from |
|
disk files |
Bragg correction |
|
ion |
Autosave every |
|
ion |
The number of ions is on the Beam tab (number_ions); it is written on the ion line of TRIM.IN.
A setting that is set back to its default is removed from the setup, and so is the settings
mapping when it becomes empty, so the setup holds only what differs from SRIM’s defaults. A
run.yaml written by TRIM.to_spec() always lists description and ranges, even at their
defaults. The TRIM.IN file is the same either way: the library writes every setting to it.
Settings the tab does not show (for example plot_mode) and a calculation 4 to 7 from a file
are kept as they are. A calculation 4 to 7 is shown as “SRIM calculation N” in the menu.
The tab has no field for plot_mode, plot_xmin, plot_xmax, reminders or version: they
are kept as they are and are edited in run.yaml, so a status bar line about one of them opens
the tab but has no field to focus.
Undo, open and save
The window edits one run setup at a time, kept in a run.yaml file (the same file the library
reads with RunSpec.from_yaml):
File > New setup (Ctrl+N) starts an empty setup.
File > Open setup… (Ctrl+O) reads a
run.yaml.File > Save setup (Ctrl+S) writes the setup to the file it came from; a new setup is saved with Save setup as… (Ctrl+Shift+S), which asks for a file.
A setup opened and saved without edits keeps the same contents. Anything the editors do not offer
(for example calculations 4 to 7, a fixed beam shape, or settings.plot_mode) is kept as it
is; the Beam tab shows a value it does not offer as YAML, and it stays until you choose another
kind.
Saving refuses an incomplete setup and says what is missing first, and a setup the library refuses is saved only once it is fixed. A file that cannot be read or written gives a message, and the setup stays as it was.
Edit > Undo and Redo (the standard keys of your platform) go back and forward through the edits since the setup was opened or created (the last 200). Each change to a field is one edit, so a typed number is one step once you press Enter or leave the field. Opening another file starts a new history, so Undo never returns to the setup that was open before.
New, Open, Open recent, Open run folder and Quit ask Discard the changes to this setup? when the setup has edits that are not saved. Choosing No keeps the setup and the window open.
Scans
The Scan tab turns the setup into a scan: the same run for many values of a parameter. Tick Run as a scan to add one; unticking it removes the scan. A setup without a scan is one run.
Parameters to vary is a table with one row per parameter. Each row has a parameter (a list of the usual ones, or Other… for any parameter by its name, for example
ion.energy_keVortarget.0.thickness_nm) and its values, typed and separated by commas, semicolons or spaces. Range… fills the values from a start, a stop and a number of values, in linear or logarithmic steps (logarithmic needs both ends above zero). Add row and Remove row change the table.Ions is either a Fixed number of ions per point or a Precision target: the scan runs batches until the error of the chosen value is within the relative or absolute error, between a minimum and a maximum number of ions, in batches of Ions per batch. The ions per point are separate from the number of ions on the Beam tab, which is the number of a single run. Batch of ions splits a point into batches of that size; One run per point (the default) does not split it.
Values from each point ticks the values to extract (for example
implant_summary,sputter_yieldorenergy_to_recoils).vacancy_at(a depth in nm) andions_in_layer(a layer, 0 for the surface) need their parameter, which the tab asks for. The values become the columns of the scan’s table and the choices of the Summary on the Results tab.Random seed is the seed of the scan. Left blank, the scan draws a seed for each point.
Some things are shown but not changed here: explicit points from a file, a python: extractor, an
extractor the tab does not offer, and keep_seed (a line that says a single run uses the setup’s
own seed). The library judges every value: a number the tab cannot read is refused and its text
stays, and the status bar names what the scan still needs.
Running
Run > Start (Ctrl+R, or Start on the toolbar) runs the setup. If the setup has no file yet, or has changes that are not saved, Start saves it first (asking for a file when it is new); when you cancel that, nothing starts. A setup the library refuses says why and does not start.
A run that is estimated to take more than two minutes is offered parallel workers in a dialog, on a
machine with at least two cores. The estimate uses the ions per second that the app measured before
for the setup’s calculation (kept in settings.json, see Settings file), or a default for each
calculation. The dialog says how long the run may take and how many units of work it has (a binned
beam has one unit per bin). Its choices are:
Run in parallel runs with the number of Workers (one core is left free by default). Split into batches of splits a single point with more than 1000 ions into batches that run at the same time. Batches use different random numbers than one run, so the results agree statistically, not point for point; the dialog says so. Run in containers is offered when a container runtime is installed and the run is estimated at an hour or more.
Run as one runs in one worker, as an ordinary run does.
Cancel starts nothing.
A run writes to a run folder next to the setup, named after it: <setup name>-runs/<UTC time>/,
for example boron-runs/20261112T101500Z/. A second run in the same second gets -2, -3 and so on.
The folder holds the scan (scan.yaml), one folder per point (points/<id>/) with the SRIM outputs,
and, once the run has finished, result/scan.csv. It is the same as a scan folder of the library
(see Scans).
While a run goes the setup is locked: its editors, Start, File > New setup, Open setup, Open recent, Open run folder and Undo and Redo are unavailable. The Progress tab opens by itself.
Pause (Run > Pause, a check box) holds back the points that have not started; clear it to go on.
Stop kills the points that are running and keeps the points that have finished. The run ends as stopped, and its results are the points that finished.
Quit during a run asks A run is going. Stop it and quit? Yes stops the run, waits for it to end (up to thirty seconds) and then quits; No keeps the window and the run open.
The ions per second that the run measured for the setup’s calculation are saved when the run ends, so the next estimate is closer.
Progress
The Progress tab shows the run as it goes, and as it ended, until the next run starts:
the summary line, with the elapsed time and the estimated time left, and the number of points that are done, running, queued, cached, failed or stopped;
the workers, each with the point it runs and its ions per second;
a table of the points, with the status, ions and values of each. A click on a column heading sorts the points by that column, and a second click reverses the order;
Open log opens the
error.logof the selected point, or of the last point that failed, in the desktop’s default program;Warnings and errors (newest first), the last twenty.
Pause and Stop on this tab are the Run actions. A run folder that is opened later (see Recent runs below) shows its final state here.
Results
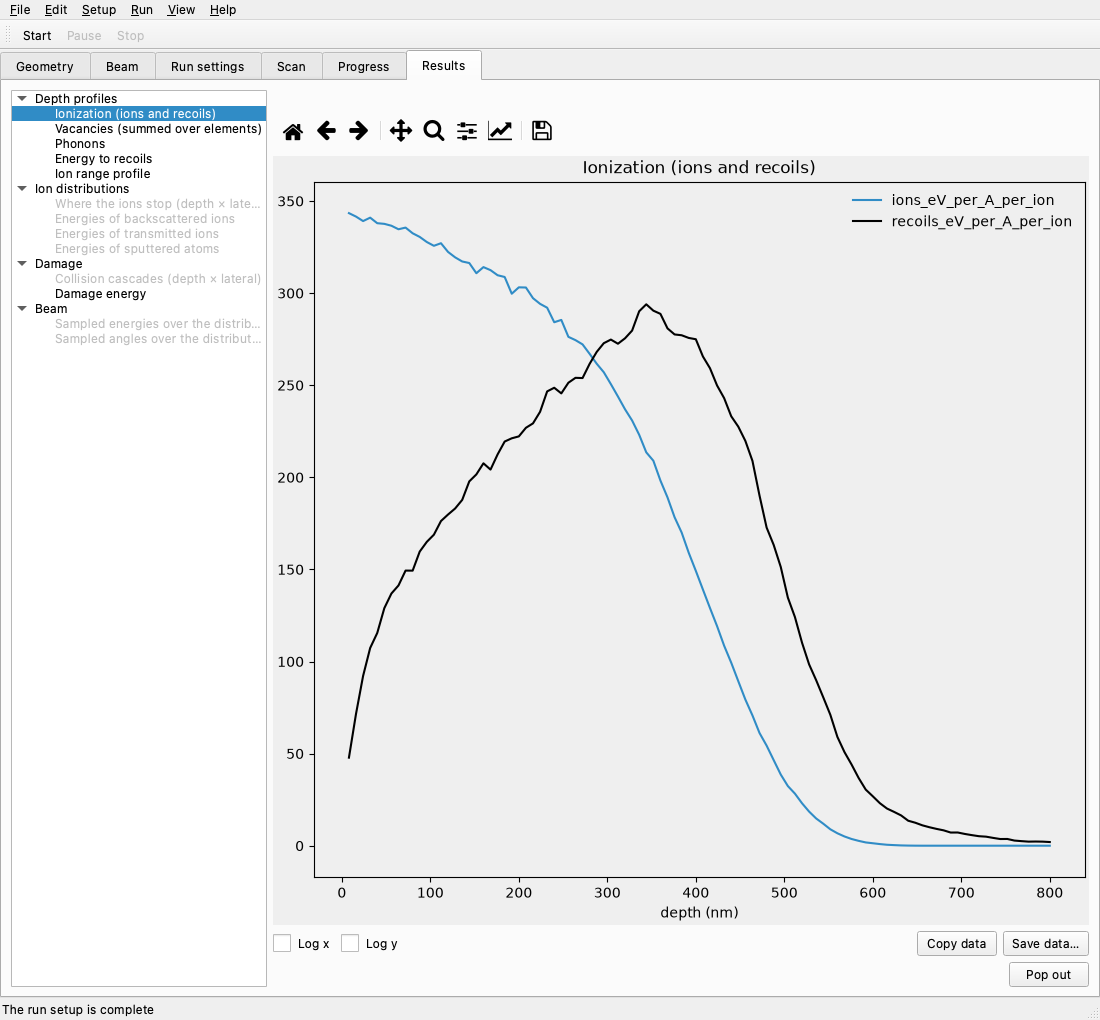
The Results tab draws the plots of a run’s results. A single run has one point, and the tab shows its plots directly. A scan lists its points in a Point box, one at a time; a point that failed is not listed. The plots are in groups:
Depth profiles: ionization, vacancies, phonons, energy to recoils and the ion range profile.
Ion distributions: where the ions stop (needs
RANGE_3D.txt), and the energies of the backscattered and transmitted ions and of the sputtered atoms.Damage: the collision cascades (needs
COLLISON.txt) and the damage energy.Beam: the energies and angles sampled over the distributions of an exact run.
Scan (for a scan only): the Summary and the overlays (below).
A plot that the points cannot give is greyed out, and its tooltip says what it needs (for example needs RANGE_3D.txt; enable ‘Ranges (RANGE_3D.txt)’ in Run settings). Plots are read from the outputs of the run, and the per-ion files are read only up to 200 000 rows, so a plot of a very large run is drawn from its first rows.
Selecting a plot draws it once. A running run draws the shown plot again every few seconds: the
interval is refresh_seconds in settings.json (5 by default). Before any result exists the tab says
No results yet., and when every point failed it says why.
Under the plot, Log x and Log y change the scales, and the toolbar moves, zooms and saves the picture. Copy data puts the plot’s data on the clipboard as CSV, and Save data… writes the same CSV to a file. Pop out opens the plot in a window of its own, which closes with the main window.
The Scan group of a scan has two kinds of view:
Summary plots an extracted value (the y box) against a parameter (the x box), with one line per value of a parameter in the colour box (or none). The error of a value is drawn as an error bar when the scan has one. During a run the summary follows the points as they finish.
An Overlay for each depth profile draws one curve per point. Tick the points to draw them, or narrow the list with the Filter, a condition such as
ion.energy_keV> 10. At most twelve curves are drawn: with more ticked, the note says Showing 12 of N curves; use the filter to choose.
Each point keeps the same colour, line style and marker in every plot of the scan, so a point can be followed from one plot to the next. A finished exact run’s sampled ions are drawn over the densities of the Beam tab.
When the setup has changed since the run, the Results tab shows From the previous setup. The results are still the run’s; the banner says the setup is not the one that ran. Undoing the change hides the banner.
A run folder that did not finish (it was stopped or crashed) is shown with the points that have results, and the status bar says This run did not finish; showing the points that have results.
Saving results
File > Save results… saves the last finished run’s results in the library’s formats. It is available after a run has finished (not for a run folder that did not finish), and not while a run goes. The dialog asks for:
a Folder (Browse…) and a Name;
the Formats: Parquet (a folder of tables), HDF5 (one file), CSV (a folder of tables with their metadata) and the SRIM output files (copied unchanged). Parquet needs the
parquetextra of pysrim2 (pyarrow) and HDF5 thehdf5extra (tables); a format whose extra is not installed is greyed out, and its tooltip names the extra;Include collision details (can be large): the collision table of each point, written in chunks. It is off by default;
for a scan, All points or Chosen points, with the points to save.
With a name N, a plain run writes N.parquet/, N.h5, N-csv/, N-raw/ (the outputs of the point,
*.txt, TRIM.IN, TRIM.DAT and run.yaml, copied unchanged) and N-run.yaml (the run’s
scan.yaml). A scan writes its table as N-scan.parquet or, in HDF5, as the table scan of N.h5;
its CSV is N-scan-csv/; each chosen point is written under N-<id>, where <id> is the first eight
characters of the point’s id. Nothing in the run folder is changed.
Before it writes anything, the save checks every file it would write. If one exists, the dialog asks before it is replaced, and only the files the save would write are removed. The save runs in a thread, and its status line says Saving….
Notebooks
Notebook starts a notebook of the open run folder, in a Notebook tab. Start marimo notebook and Start Jupyter notebook use the two tools; the tab shows the notebook as a web page inside the window. Only one notebook is open at a time. Starting another one asks A notebook is open. Stop it and start this one?: Yes stops the open notebook, No keeps it.
A menu entry that cannot be used is greyed out, and its tooltip and status bar say why. Starting needs a run folder (Run the setup or open a run folder first). A missing tool or WebEngine says Reinstall the app: pysrim2 install app. Export PDF… is greyed out with Start a notebook first when no notebook is open, and while an export runs it says Exporting the notebook to PDF….
Where it is saved. The notebook is notebook.py (marimo) or notebook.ipynb (Jupyter) in the
run folder. The starter is copied in only when that file is missing, so an edited notebook is kept
when you start it again. The app’s own files go in .pysrim2-notebook/ in the run folder: reload
(what Reload touches), loaded.json (how many points the notebook has loaded), and for each server
a token-<tag> file and a server-<tag>.log file, both readable by you only (POSIX file modes, 0600;
on Windows the folder’s permissions apply). The token file is removed when the server stops, and the
token is taken out of the log then too. The folder keeps the newest five server logs.
What the starter does. Both starters read the run folder with srim.notebook.load_run and show
the scan’s table, and a plot. For a finished scan with more than one point the plot is the scan’s extracted
value; otherwise (one point, or a run that has not finished, whose table has no extracted values) it is
the ionisation of the first point that has results. With no point that has results, they say
so. The marimo starter has a Follow the run box (every 5 s, 10 s, 30 s or 1 min) that loads the
run again at that interval; the Jupyter starter has no timer. Its loading cell reads the run and
marks it as loaded; the cells after it show the table and the plot.
The banner. When the run has results that the notebook has not loaded, the tab shows New results since the notebook loaded them. The banner appears only after the notebook has loaded the run once, and the app checks for new results every few seconds while the tab is shown.
Reload for marimo touches the reload file: the notebook loads the new results, and the banner goes away.
Reload for Jupyter cannot reload the notebook for you. It says Run the first cell again to load them. and the banner adds the same text, so run the first cell.
A notebook stays on the run folder it was started with. A new run does not switch it: to see the new run, start the notebook again.
Open in browser opens the notebook’s address in your default browser. The address holds the notebook’s token, so treat it like a password. The server listens on 127.0.0.1 only (this computer, not the network), and the token is random for each start. It is never on a command line.
Stop notebook (the button, or Notebook > Stop notebook) stops the server and closes the tab. The
notebook also stops when the window closes, and when the app quits. On Windows the server is stopped
together with the processes it started. Stopping does not change the notebook file or the results.
If the app is killed (not closed), the notebook server may keep running, and its token file stays in
.pysrim2-notebook until the server is stopped.
Export PDF… (the button in the tab, or Notebook > Export PDF…) asks for a file, by default
notebook.pdf in the run folder. The export runs in the background, one at a time, and the status bar
says when it is done or why it failed. A marimo PDF includes the code cells. A Jupyter PDF is printed
by nbconvert with Chromium, which is downloaded by pysrim2 install app (see Install). The file is
written beside the one you chose and replaces it only when the export succeeds.
If a Jupyter PDF export fails, check your own Jupyter configuration in ~/.jupyter: nbconvert reads
it for the export, and a broken file there makes the export fail. Fix or move that file and export
again.
Recent runs
File > Open recent lists the last ten setups and run folders, newest first. A setup is recorded
when it is opened or saved, and a run folder when its run ends. The list is kept in recent.json in
the app’s folder (see Settings file). An entry that cannot be opened now is greyed out, and its
tooltip says why: the file or the folder was moved or deleted, or the folder is not a pysrim2 run
folder.
File > Open run folder… opens a run folder that you choose: a folder that a run made, with its
scan.yaml. Its setup is opened into the window, and its results and final progress are shown as
they were at the end of the run. Unsaved edits are asked about first, as for any other open.
Opening a run folder, from Open run folder… or from an entry of Open recent, moves it to the front
of the list as a run entry. Its setup is not recorded on its own. The scan.yaml of a run folder is
never saved in place: Save setup, Save setup as… and Start ask for a file of their own first.
The file dialog proposes a name beside the run folders: for run-runs/<stamp>/scan.yaml it
proposes run.yaml in the same folder as run-runs.
Themes
View > Theme chooses System (the default: follow the operating system), Light or Dark. The choice is saved and applies at once.
Settings file
The app’s choices are stored in <data dir>/app/settings.json, where <data dir> is the
pysrim2 data directory (see Installation). It holds the route (native, wine,
container, or null before a choice), the theme (system, light or dark), the
ions_per_s of each calculation (the latest measured rate, used for the parallel estimate) and
the refresh_seconds of the Results tab (5 by default; the window has no field for it). The
recent setups and runs are in <data dir>/app/recent.json. A missing or broken file gives the
defaults, so the app always starts. You can delete a file to start from its defaults again.