Gallery
Each picture on this page is made by the script shown under it. The scripts are in
docs/gallery/, and one command rebuilds all the pictures from them. The pictures of
SRIM runs use real SRIM output with fixed seeds. The live-view
screenshots use illustrative values from a scripted event stream, not from a SRIM run.
Collision cascades of 4.5 MeV carbon ions in SiC (COLLISON.txt)
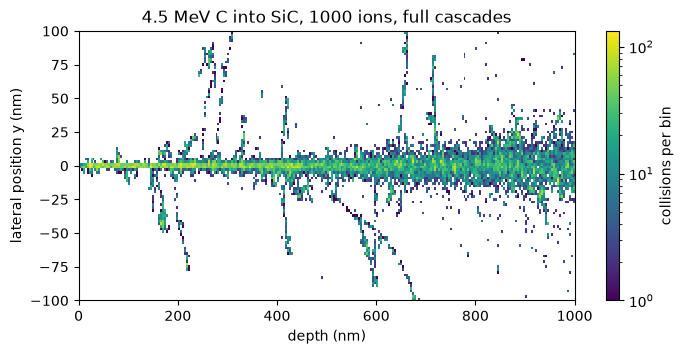
Every collision of 1000 carbon ions and of the target atoms they set moving, counted by
depth and lateral position. The ion tracks run along the middle; the lines that branch off
are recoils. The data is the full-cascade output committed in test_files/SiC-C, so no SRIM
run is needed.
"""Where the collisions of 1000 carbon ions in SiC happen: a map of the full cascades.

``COLLISON.txt`` of a full-cascade run lists every collision of the ions and their recoils.
``Collision.iter_events()`` streams it, so even a file of many gigabytes needs little memory.
The data is the SRIM output committed in ``test_files/SiC-C`` (4.5 MeV C into 1 µm of SiC,
1000 ions), so no SRIM run is needed.
"""

from pathlib import Path

import matplotlib.pyplot as plt
import numpy as np
from matplotlib.colors import LogNorm

from srim.output import Collision

TITLE = "Collision cascades of 4.5 MeV carbon ions in SiC (COLLISON.txt)"
NEEDS_SRIM = False
OUTPUT = "tracks.png"

FIXTURE = Path(__file__).resolve().parents[2] / "test_files" / "SiC-C"


def make(outdir):
    events = Collision(str(FIXTURE)).iter_events()
    depth, lateral = np.array([(e["depth_A"], e["y_A"]) for e in events]).T

    fig, ax = plt.subplots(figsize=(8, 3.5), dpi=100)
    _, _, _, image = ax.hist2d(
        depth / 10, lateral / 10, bins=(250, 100), range=((0, 1000), (-100, 100)), norm=LogNorm()
    )
    fig.colorbar(image, ax=ax, label="collisions per bin")
    ax.set_xlabel("depth (nm)")
    ax.set_ylabel("lateral position y (nm)")
    ax.set_title("4.5 MeV C into SiC, 1000 ions, full cascades")

    path = Path(outdir) / OUTPUT
    fig.savefig(path, bbox_inches="tight")
    plt.close(fig)
    return path
Where 10,000 nickel ions at 5 MeV stop in nickel (RANGE_3D.txt)
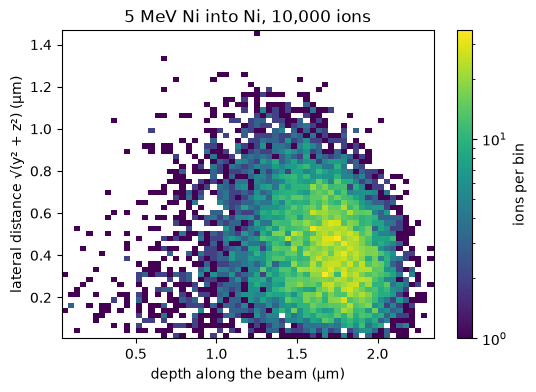
The final positions of 10,000 ions of a 3D range run, counted by depth along the beam and by lateral distance from it. A quick Kinchin-Pease run. Needs SRIM.
"""Where the ions of a 3D range run stop in the target: 10,000 ions, a quick Kinchin-Pease run.

``ranges=1`` makes TRIM write ``RANGE_3D.txt``, the final position of every ion. Needs SRIM.
"""

from pathlib import Path

import matplotlib.pyplot as plt
import numpy as np
from matplotlib.colors import LogNorm

from srim import TRIM, Ion, Layer, Target

TITLE = "Where 10,000 nickel ions at 5 MeV stop in nickel (RANGE_3D.txt)"
NEEDS_SRIM = True
OUTPUT = "heatmap.png"

IONS = 10_000


def make(outdir):
    target = Target([Layer.from_formula("Ni", density=8.9, width=40000.0)])  # 4 um
    trim = TRIM(target, Ion("Ni", energy=5e6), number_ions=IONS, ranges=1, random_seed=12345)
    df = trim.run().range3d.df
    depth_um = df["depth_A"] / 1e4
    lateral_um = np.hypot(df["y_A"], df["z_A"]) / 1e4

    fig, ax = plt.subplots(figsize=(6, 4), dpi=100)
    _, _, _, image = ax.hist2d(depth_um, lateral_um, bins=60, norm=LogNorm())
    fig.colorbar(image, ax=ax, label="ions per bin")
    ax.set_xlabel("depth along the beam (µm)")
    ax.set_ylabel("lateral distance √(y² + z²) (µm)")
    ax.set_title(f"5 MeV Ni into Ni, {IONS:,} ions")

    path = Path(outdir) / OUTPUT
    fig.savefig(path, bbox_inches="tight")
    plt.close(fig)
    return path
Ionization and vacancies against depth
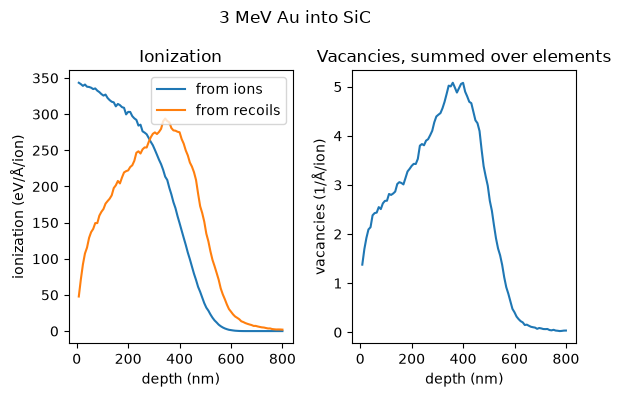
Ionization from ions and from recoils, and the vacancies, against depth for 3 MeV gold
into SiC. The data is the full-cascade output committed in test_files/2.
"""Depth profiles of ionization and vacancies from a full cascade run (test_files/2)."""

from pathlib import Path

import matplotlib.pyplot as plt

from srim.output import Results

TITLE = "Ionization and vacancies against depth"
NEEDS_SRIM = False
OUTPUT = "depth_profiles.png"

FIXTURE = Path(__file__).resolve().parents[2] / "test_files" / "2"


def make(outdir):
    results = Results(str(FIXTURE))
    ioniz = results.ioniz.df
    vacancy = results.vacancy.df
    vacancy_columns = [c for c in vacancy.columns if c.startswith("vacancies_")]

    fig, (left, right) = plt.subplots(1, 2, figsize=(6, 4), dpi=100)
    left.plot(ioniz["depth_A"] / 10, ioniz["ions_eV_per_A_per_ion"], label="from ions")
    left.plot(ioniz["depth_A"] / 10, ioniz["recoils_eV_per_A_per_ion"], label="from recoils")
    left.set_xlabel("depth (nm)")
    left.set_ylabel("ionization (eV/Å/ion)")
    left.set_title("Ionization")
    left.legend(loc="upper right")

    right.plot(vacancy["depth_A"] / 10, vacancy[vacancy_columns].sum(axis=1))
    right.set_xlabel("depth (nm)")
    right.set_title("Vacancies, summed over elements")
    right.set_ylabel("vacancies (1/Å/ion)")

    fig.suptitle("3 MeV Au into SiC")
    fig.tight_layout()

    path = Path(outdir) / OUTPUT
    fig.savefig(path, bbox_inches="tight")
    plt.close(fig)
    return path
A parameter scan: mean depth against energy, one line per angle
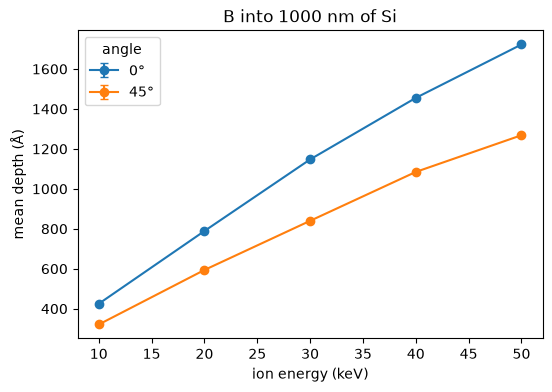
The mean depth of boron ions in silicon from 10 to 50 keV, at 0 and 45 degrees. Each point is a quick SRIM run of 2000 ions, and the points run on two worker processes. Needs SRIM.
"""Mean depth of B ions in Si against the energy, one line per angle: a parameter scan.

The base run and the seed are those of ``examples/scripts/angle_energy_scan.py``; this entry
scans more energies (10 to 50 keV) at two angles (0 and 45 degrees), ten points of 2000 ions on
two worker processes, a quick Kinchin-Pease run each. Needs SRIM.
"""

import importlib.util
import tempfile
from pathlib import Path

import matplotlib.pyplot as plt

from srim.scan import Scan, run_scan

TITLE = "A parameter scan: mean depth against energy, one line per angle"
NEEDS_SRIM = True
OUTPUT = "scan_plot.png"

ROOT = Path(__file__).resolve().parents[2]

# 2000 ions per point (the example uses 50), so that the lines are smooth.
IONS = 2000


def _example(name):
    path = ROOT / "examples" / "scripts" / f"{name}.py"
    spec = importlib.util.spec_from_file_location(f"gallery_example_{name}", path)
    module = importlib.util.module_from_spec(spec)
    spec.loader.exec_module(module)
    return module


def make(outdir):
    example = _example("angle_energy_scan")
    scan = Scan(
        example.base_spec(),
        grid={"ion.energy_keV": [10.0, 20.0, 30.0, 40.0, 50.0], "ion.angle_deg": [0.0, 45.0]},
        extract=["implant_summary"],
        ions=IONS,
        seed=example.SEED,
    )
    fig, ax = plt.subplots(figsize=(6, 4), dpi=100)
    with tempfile.TemporaryDirectory() as tmp:
        result = run_scan(scan, workers=2, scan_dir=Path(tmp) / "scan")
        result.plot(x="ion.energy_keV", y="mean_depth_A", ax=ax)
    handles, labels = ax.get_legend_handles_labels()
    angles = [f"{float(label.split('=')[1]):g}°" for label in labels]
    ax.legend(handles, angles, title="angle")
    ax.set_xlabel("ion energy (keV)")
    ax.set_ylabel("mean depth (Å)")
    ax.set_title("B into 1000 nm of Si")

    path = Path(outdir) / OUTPUT
    fig.savefig(path, bbox_inches="tight")
    plt.close(fig)
    return path
The live plot of a running scan (pysrim2 scan run –ui plot)
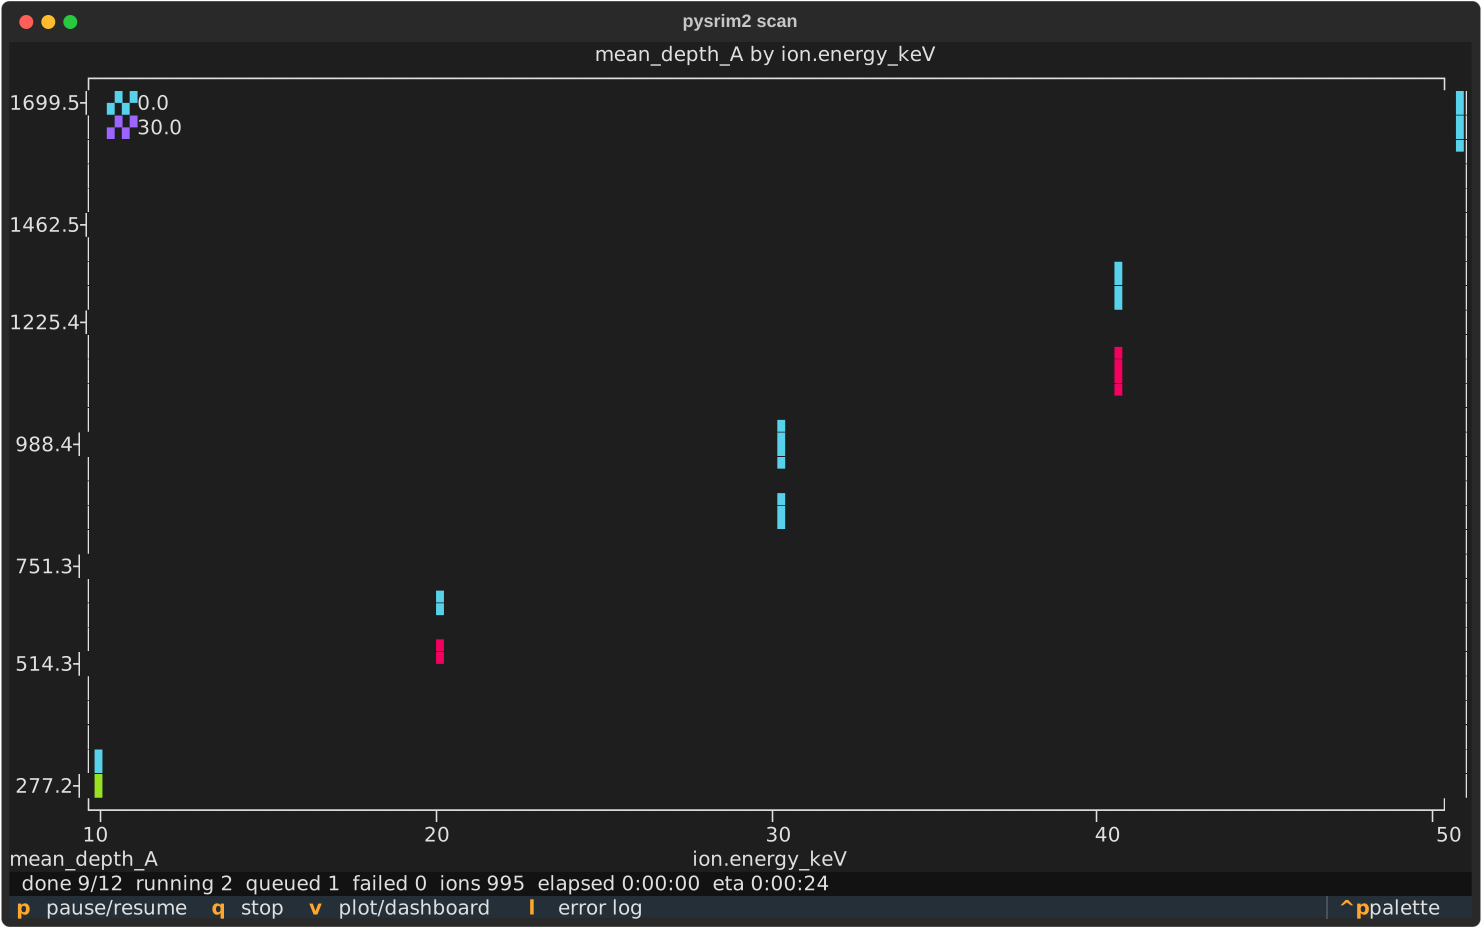
The plot view of a scan while it runs: the finished points and the values so far. The values are illustrative, from a scripted event stream.
"""The live plot view of a running scan, drawn from a scripted event stream."""

import sys
from pathlib import Path

sys.path.insert(0, str(Path(__file__).parent))
from _live import screenshot  # noqa: E402  (the values are illustrative)

TITLE = "The live plot of a running scan (pysrim2 scan run --ui plot)"
NEEDS_SRIM = False
OUTPUT = "tui_plot.svg"


def make(outdir):
    return screenshot("plot", Path(outdir), OUTPUT)
The scan dashboard (–ui dashboard)
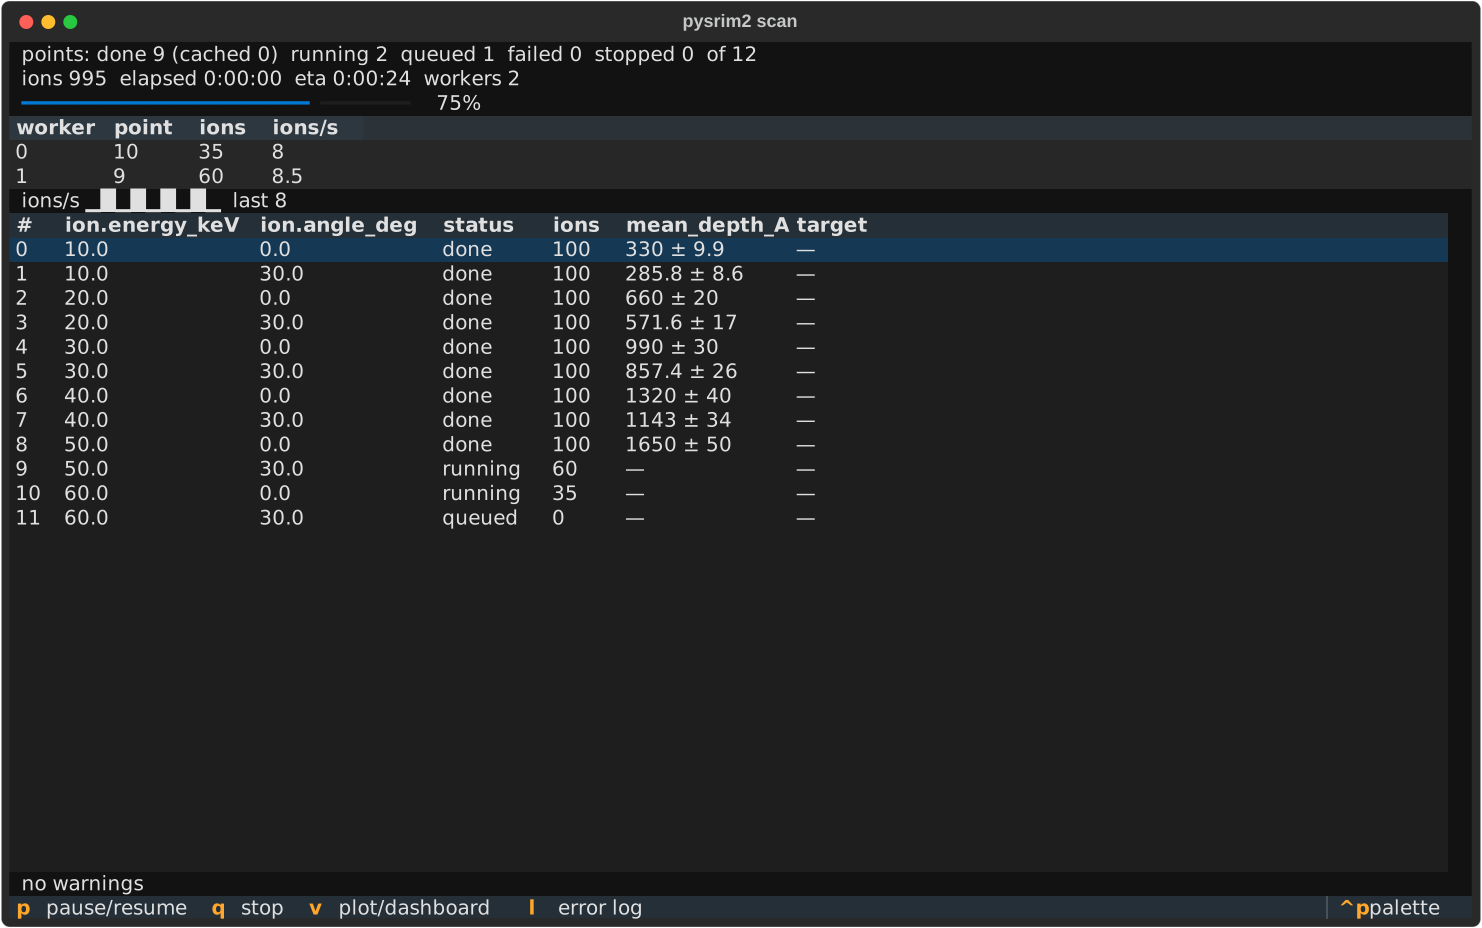
The dashboard view of the same kind of scan: the state of each point and of the workers. The values are illustrative, as in the picture above.
"""The dashboard view of a running scan, drawn from a scripted event stream."""

import sys
from pathlib import Path

sys.path.insert(0, str(Path(__file__).parent))
from _live import screenshot  # noqa: E402  (the values are illustrative)

TITLE = "The scan dashboard (--ui dashboard)"
NEEDS_SRIM = False
OUTPUT = "tui_dashboard.svg"


def make(outdir):
    return screenshot("dashboard", Path(outdir), OUTPUT)
A beam with a 1 keV Gaussian energy spread (exact mode)
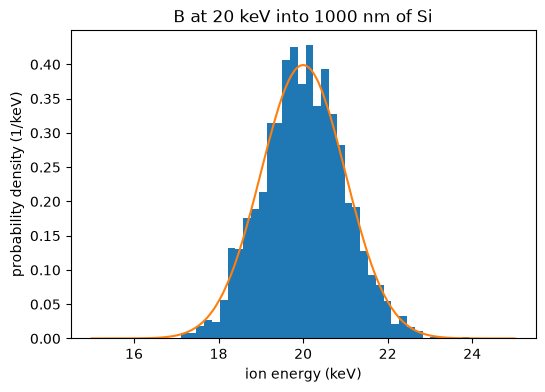
The energies of 2000 boron ions that SRIM ran in exact mode, drawn over the Gaussian density the beam was defined with. Needs SRIM.
"""A beam with a Gaussian energy spread: the ions SRIM ran (exact mode), drawn over the density.

The beam is the one of ``examples/scripts/beam_energy_spread.py``: 2000 B ions at 20 keV with
a 1 keV Gaussian spread. Needs SRIM.
"""

import importlib.util
import tempfile
from pathlib import Path

import matplotlib.pyplot as plt

from srim.beam import plot_beam, run_beam

TITLE = "A beam with a 1 keV Gaussian energy spread (exact mode)"
NEEDS_SRIM = True
OUTPUT = "beam.png"

ROOT = Path(__file__).resolve().parents[2]

IONS = 2000


def _example(name):
    path = ROOT / "examples" / "scripts" / f"{name}.py"
    spec = importlib.util.spec_from_file_location(f"gallery_example_{name}", path)
    module = importlib.util.module_from_spec(spec)
    spec.loader.exec_module(module)
    return module


def make(outdir):
    spec = _example("beam_energy_spread").beam_spec("exact", IONS)
    fig, ax = plt.subplots(figsize=(6, 4), dpi=100)
    with tempfile.TemporaryDirectory() as tmp:
        with run_beam(spec, output_dir=Path(tmp) / "exact") as results:
            plot_beam(results, "energy_keV", ax=ax, bins=40)
    ax.set_xlabel("ion energy (keV)")
    ax.set_ylabel("probability density (1/keV)")
    ax.set_title("B at 20 keV into 1000 nm of Si")

    path = Path(outdir) / OUTPUT
    fig.savefig(path, bbox_inches="tight")
    plt.close(fig)
    return path
The desktop app: the boron reference setup on the Geometry tab
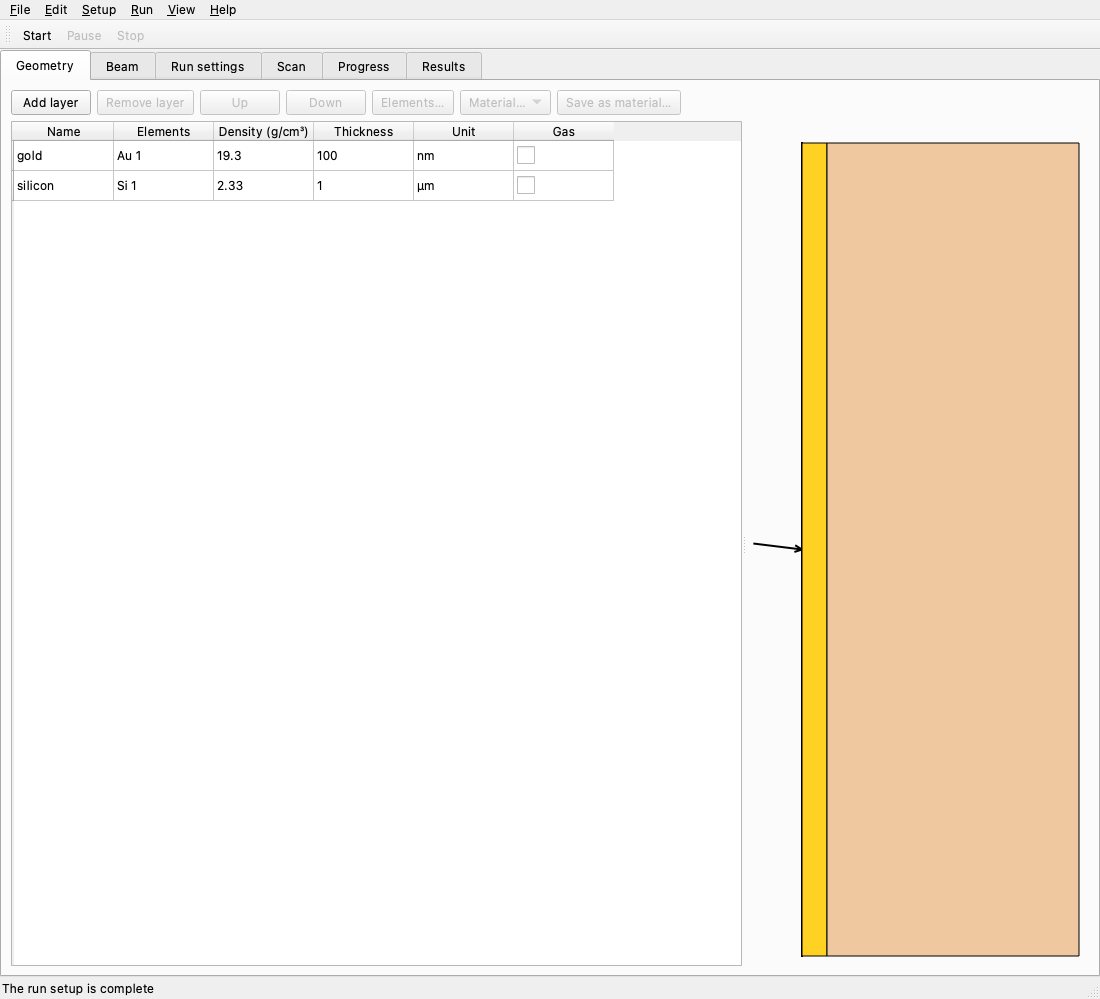
The window of pysrim2 app with the boron reference case of First simulation
(100 nm of gold on silicon). The target is drawn to scale beside the layer table, and the
status bar says the setup is complete. The script builds the setup in code and needs the
app extra; it makes no SRIM run.
"""The desktop app on the boron reference setup: the Geometry tab, with the target to scale.

The setup is the boron reference case of docs/first-simulation.md, built here in code: 200 B
ions at 20 keV and 7 degrees into 100 nm of Au on Si, seed 12345. It needs the app extra
(PySide6); the window runs offscreen, with no install or check.
"""

import sys
from pathlib import Path

sys.path.insert(0, str(Path(__file__).parent))
from _app_shots import grab_setup  # noqa: E402

TITLE = "The desktop app: the boron reference setup on the Geometry tab"
NEEDS_SRIM = False
OUTPUT = "app_setup.png"

SETUP = {
    "version": 1,
    "ion": {"symbol": "B", "energy_keV": 20.0, "angle_deg": 7.0},
    "number_ions": 200,
    "calculation": 1,
    "seed": 12345,
    "settings": {},
    "target": [
        {
            "name": "gold",
            "thickness_nm": 100.0,
            "density_g_cm3": 19.3,
            "phase": 0,
            "elements": [
                {
                    "symbol": "Au",
                    "stoich": 1.0,
                    "displacement_eV": 25.0,
                    "lattice_eV": 3.0,
                    "surface_eV": 3.0,
                }
            ],
        },
        {
            "name": "silicon",
            "thickness_nm": 1000.0,
            "density_g_cm3": 2.33,
            "phase": 0,
            "elements": [
                {
                    "symbol": "Si",
                    "stoich": 1.0,
                    "displacement_eV": 15.0,
                    "lattice_eV": 2.0,
                    "surface_eV": 4.7,
                }
            ],
        },
    ],
}


def make(outdir):
    return grab_setup(SETUP, Path(outdir) / OUTPUT)
The desktop app: the results of a finished run
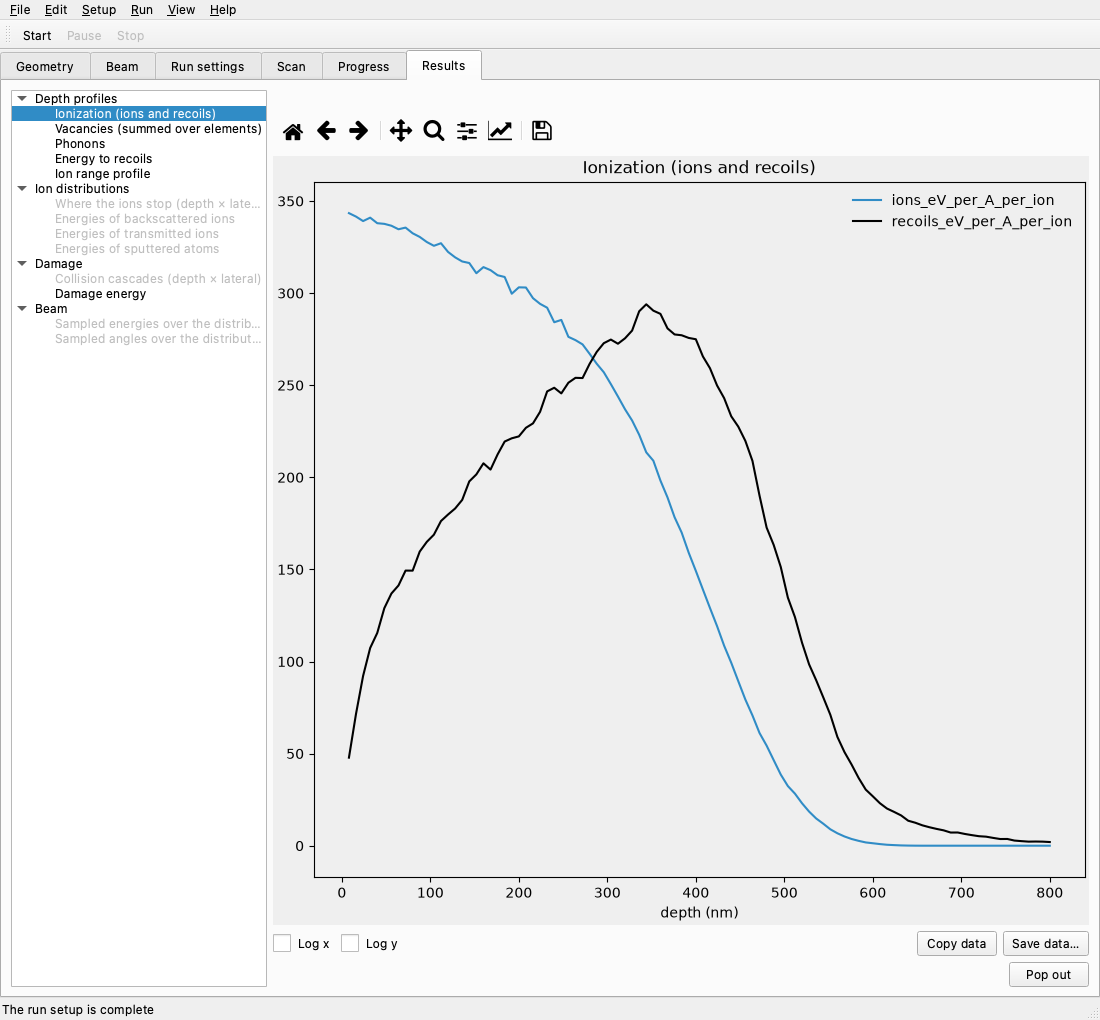
The Results tab of a finished run, with the ionization profile of 3 MeV gold in SiC. The run
folder is built from the outputs of test_files/2 as a run leaves it, so no SRIM run is
needed. See Desktop app for the tabs.
"""The desktop app's Results tab: the ionization profile of a finished run.

The run is 3 MeV Au into SiC, the SRIM outputs of test_files/2 (a full cascade), opened as a
run folder would be. No SRIM run is made. It needs the app extra (PySide6); the window runs
offscreen.
"""

import sys
from pathlib import Path

sys.path.insert(0, str(Path(__file__).parent))
from _app_shots import grab_results  # noqa: E402

TITLE = "The desktop app's Results tab: ionization against depth of a finished run"
NEEDS_SRIM = False
OUTPUT = "app_results.png"


def make(outdir):
    return grab_results(Path(outdir) / OUTPUT)
The agent example: 200 boron ions into gold on silicon
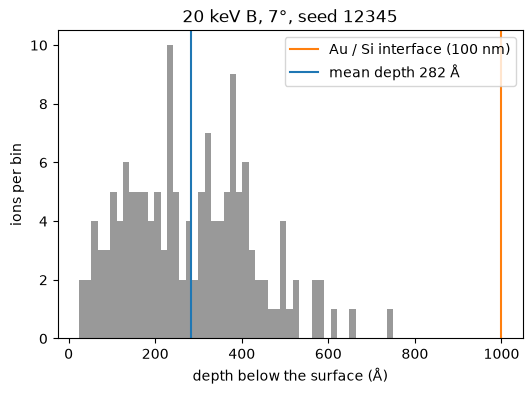
The depth of the ions in the reference case, with the Au/Si interface and the mean depth marked. An AI agent with the pysrim2 skill was given this prompt:
Simulate a 100 nm gold layer on a silicon wafer, implant 200 boron ions at 7 degrees and 20 keV, and give me a pandas DataFrame of implantation depth and xy straggle.
The picture is made by the same boron script that the skill ships, run with seed 12345.
The gallery script calls that script’s run() function. Needs SRIM. See
Agent guide for the whole agent route.
"""The agent reference case: where 200 boron ions stop in 100 nm of gold on silicon.

The run is the one of ``examples/scripts/boron_in_gold_on_silicon.py`` (20 keV, 7 degrees,
seed 12345). The histogram is drawn from ``RANGE_3D.txt``. Needs SRIM.
"""

import importlib.util
import tempfile
from pathlib import Path

import matplotlib.pyplot as plt

from srim.output import Range3D

TITLE = "The agent example: 200 boron ions into gold on silicon"
NEEDS_SRIM = True
OUTPUT = "agent_boron.png"

ROOT = Path(__file__).resolve().parents[2]
INTERFACE_A = 1000.0  # the Au layer is 100 nm = 1000 angstrom


def _example(name):
    path = ROOT / "examples" / "scripts" / f"{name}.py"
    spec = importlib.util.spec_from_file_location(f"gallery_example_{name}", path)
    module = importlib.util.module_from_spec(spec)
    spec.loader.exec_module(module)
    return module


def make(outdir):
    boron = _example("boron_in_gold_on_silicon")
    with tempfile.TemporaryDirectory() as tmp:
        summary = boron.run(200, Path(tmp) / "out")
        depth = Range3D(str(Path(tmp) / "out")).df["depth_A"]
    mean = summary["mean_depth_A"]
    fig, ax = plt.subplots(figsize=(6, 4), dpi=100)
    ax.hist(depth, bins=50, color="0.6")
    ax.axvline(INTERFACE_A, color="C1", label="Au / Si interface (100 nm)")
    ax.axvline(mean, color="C0", label=f"mean depth {mean:.0f} Å")
    ax.legend()
    ax.set_xlabel("depth below the surface (Å)")
    ax.set_ylabel("ions per bin")
    ax.set_title("20 keV B, 7°, seed 12345")

    path = Path(outdir) / OUTPUT
    fig.savefig(path, bbox_inches="tight")
    plt.close(fig)
    return path
Rebuild the pictures
Run from the repository root. The pictures are rebuilt on a machine with SRIM
(pysrim2 install); entries that need SRIM are skipped with a message without it.
uv run --extra plot --extra tui --extra app python docs/gallery/make.py          # all entries
uv run --extra plot --extra tui --extra app python docs/gallery/make.py --list   # list the entries
uv run --extra plot --extra tui --extra app python docs/gallery/make.py heatmap  # one or more names
The app extra (PySide6) is needed for the two pictures of the desktop app; the window
runs offscreen, so no display is needed.
Each committed image must stay under 300 KB.